
AlaskaTSL-FWI™
West Harrison Bay · Honeymoon 3D · North SlopeFive prospects, straight through the permafrost
2 vibroseis surveys from 2006 over a frozen layer that leave the legacy image blank exactly where the topsets sit. We inverted both surveys together with TSL-FWI™ to 45 Hz. The blank zone now holds five AVA prospects.
- Estimated recoverable*
- 2 bn bbls
- Prospects defined
- 5
- TSL-FWI, 2 surveys merged
- 45 Hz
- Lowest usable frequency
- 8 Hz
* Reserve and prospect counts are the operator's estimates.
Harrison Bay, west of the Colville
The surveyed block sits in 21 ft of water in West Harrison Bay — on trend with the Nanushuk topset play with discoveries including Willow and Pikka and just off the Beaufort coast of the National Petroleum Reserve (NPRA).
- Cyan outline
- Survey area — West Harrison Bay
- White dot
- Village or hub
- Open square
- Unit or field
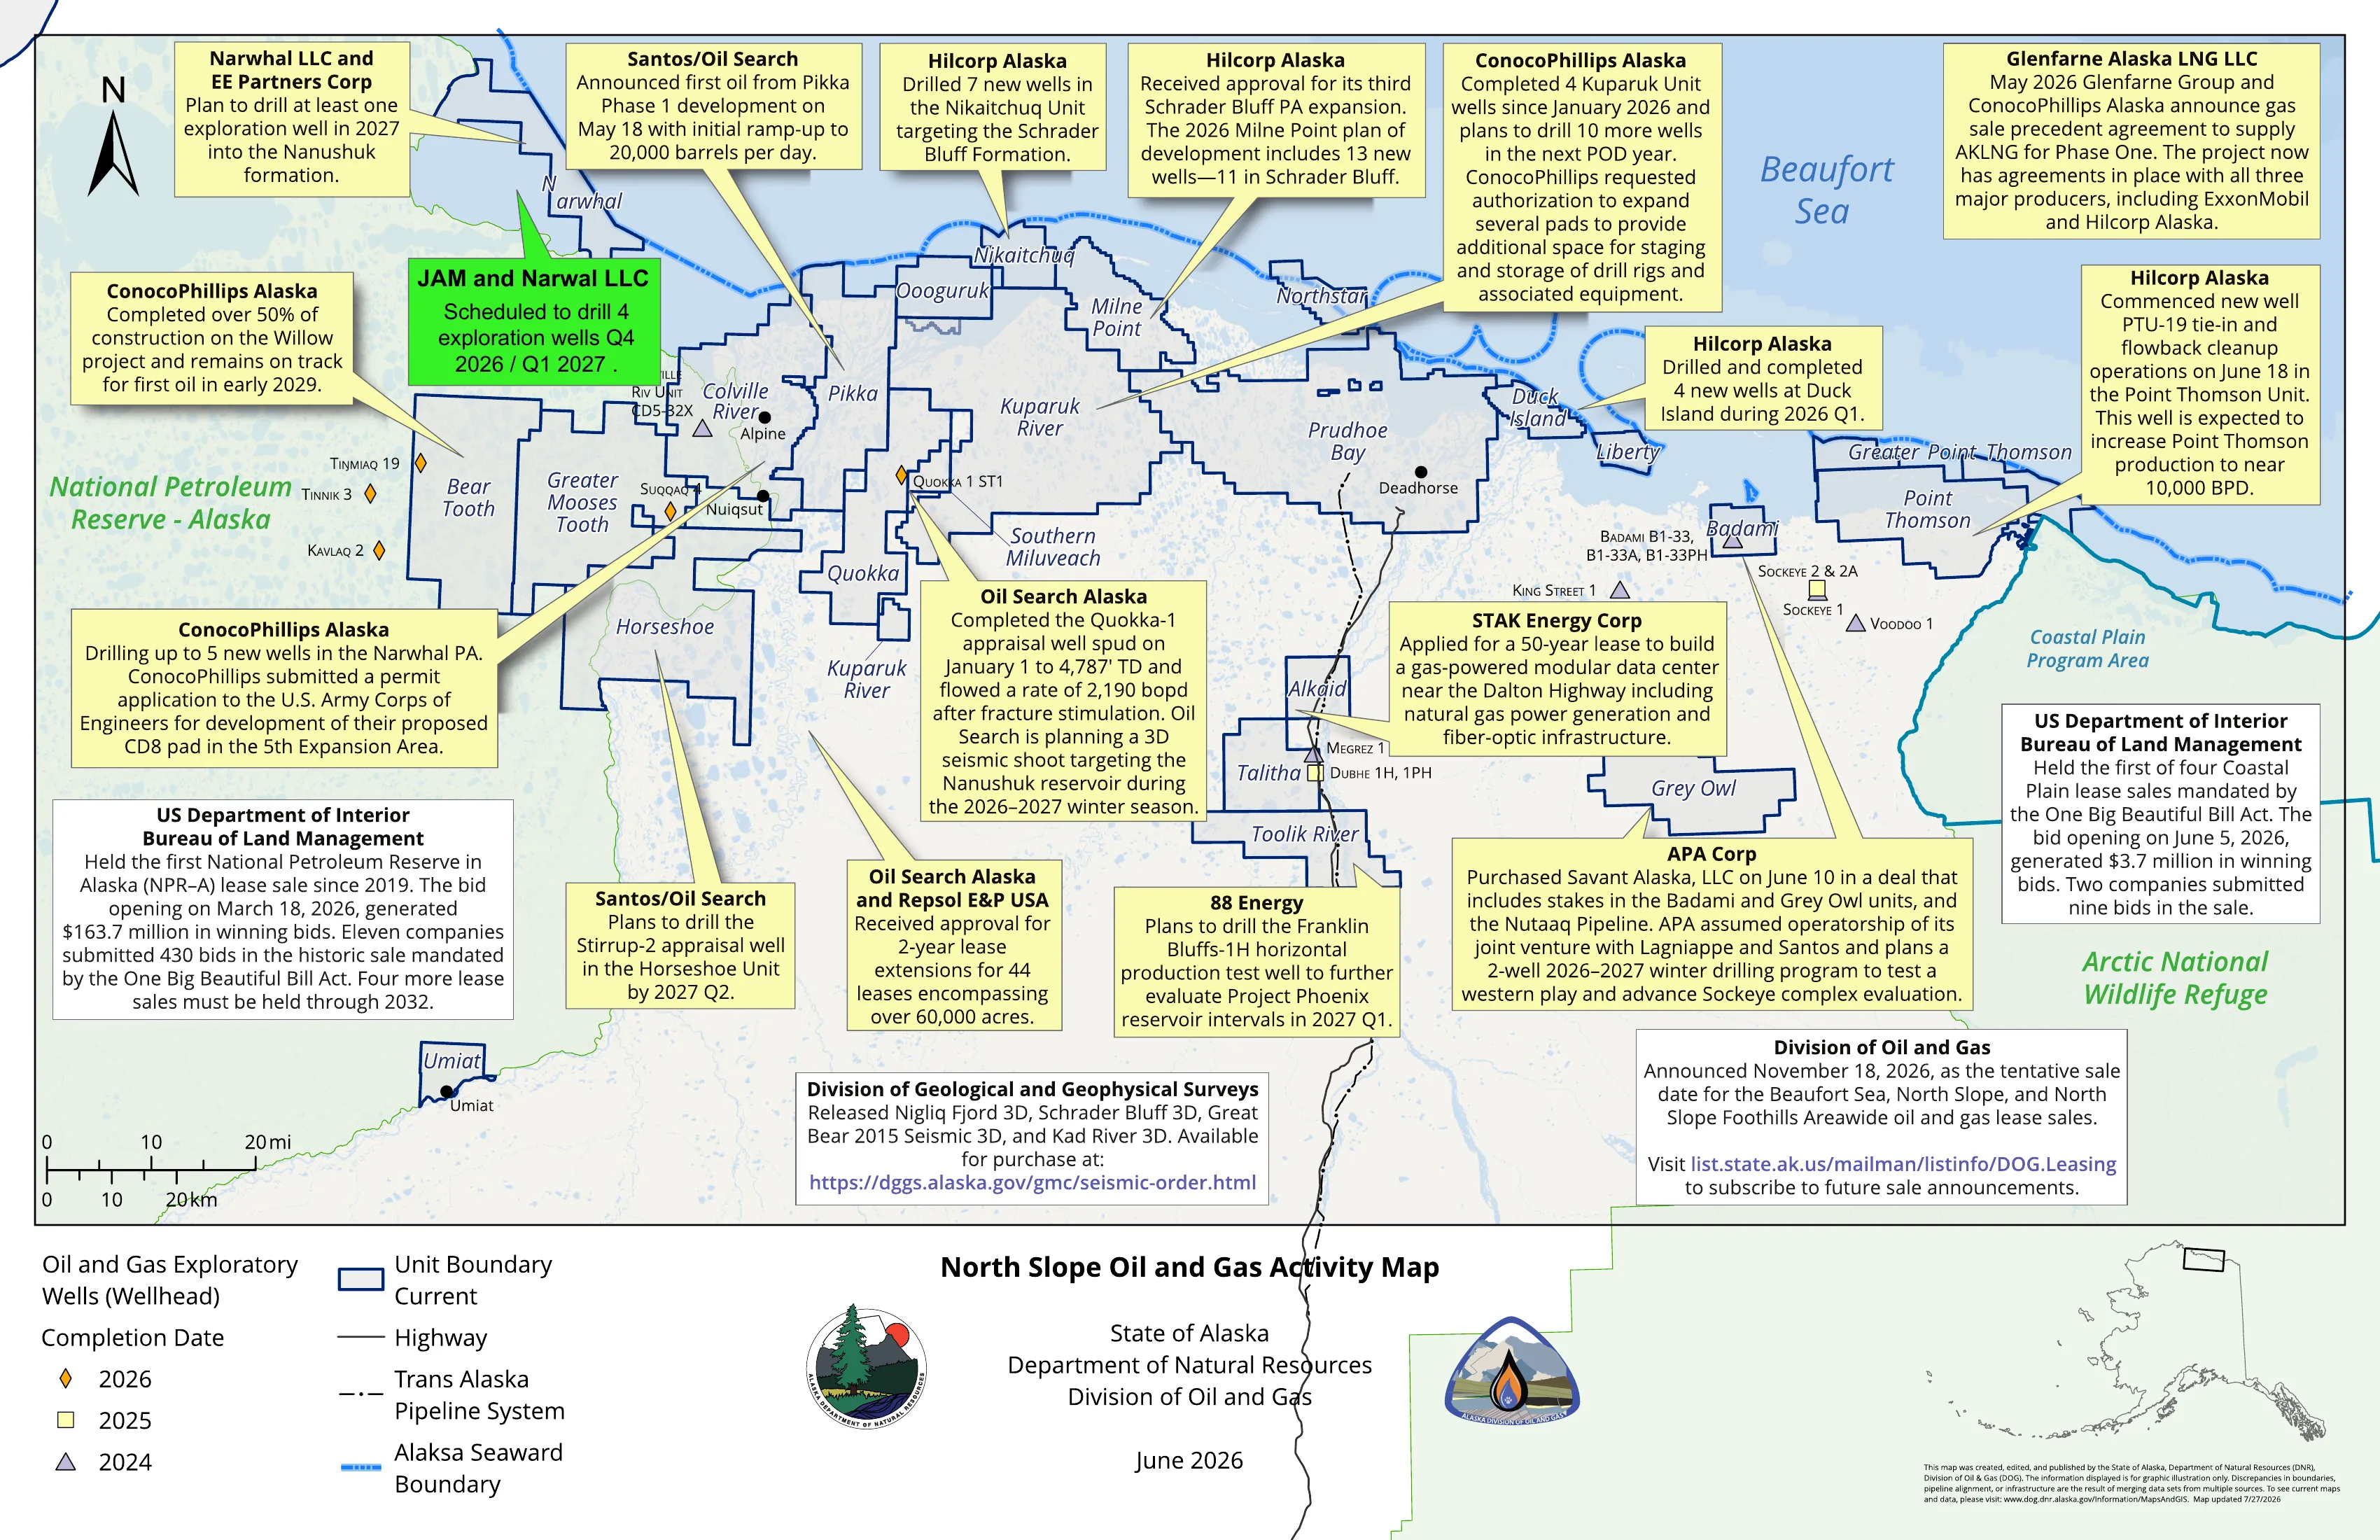
See the full North Slope activity mapThe State of Alaska sheet this map was drawn from — unit boundaries, exploratory wells and operator activity across the Slope, with the JAM / Narwal wells marked
Watch the model fix the image
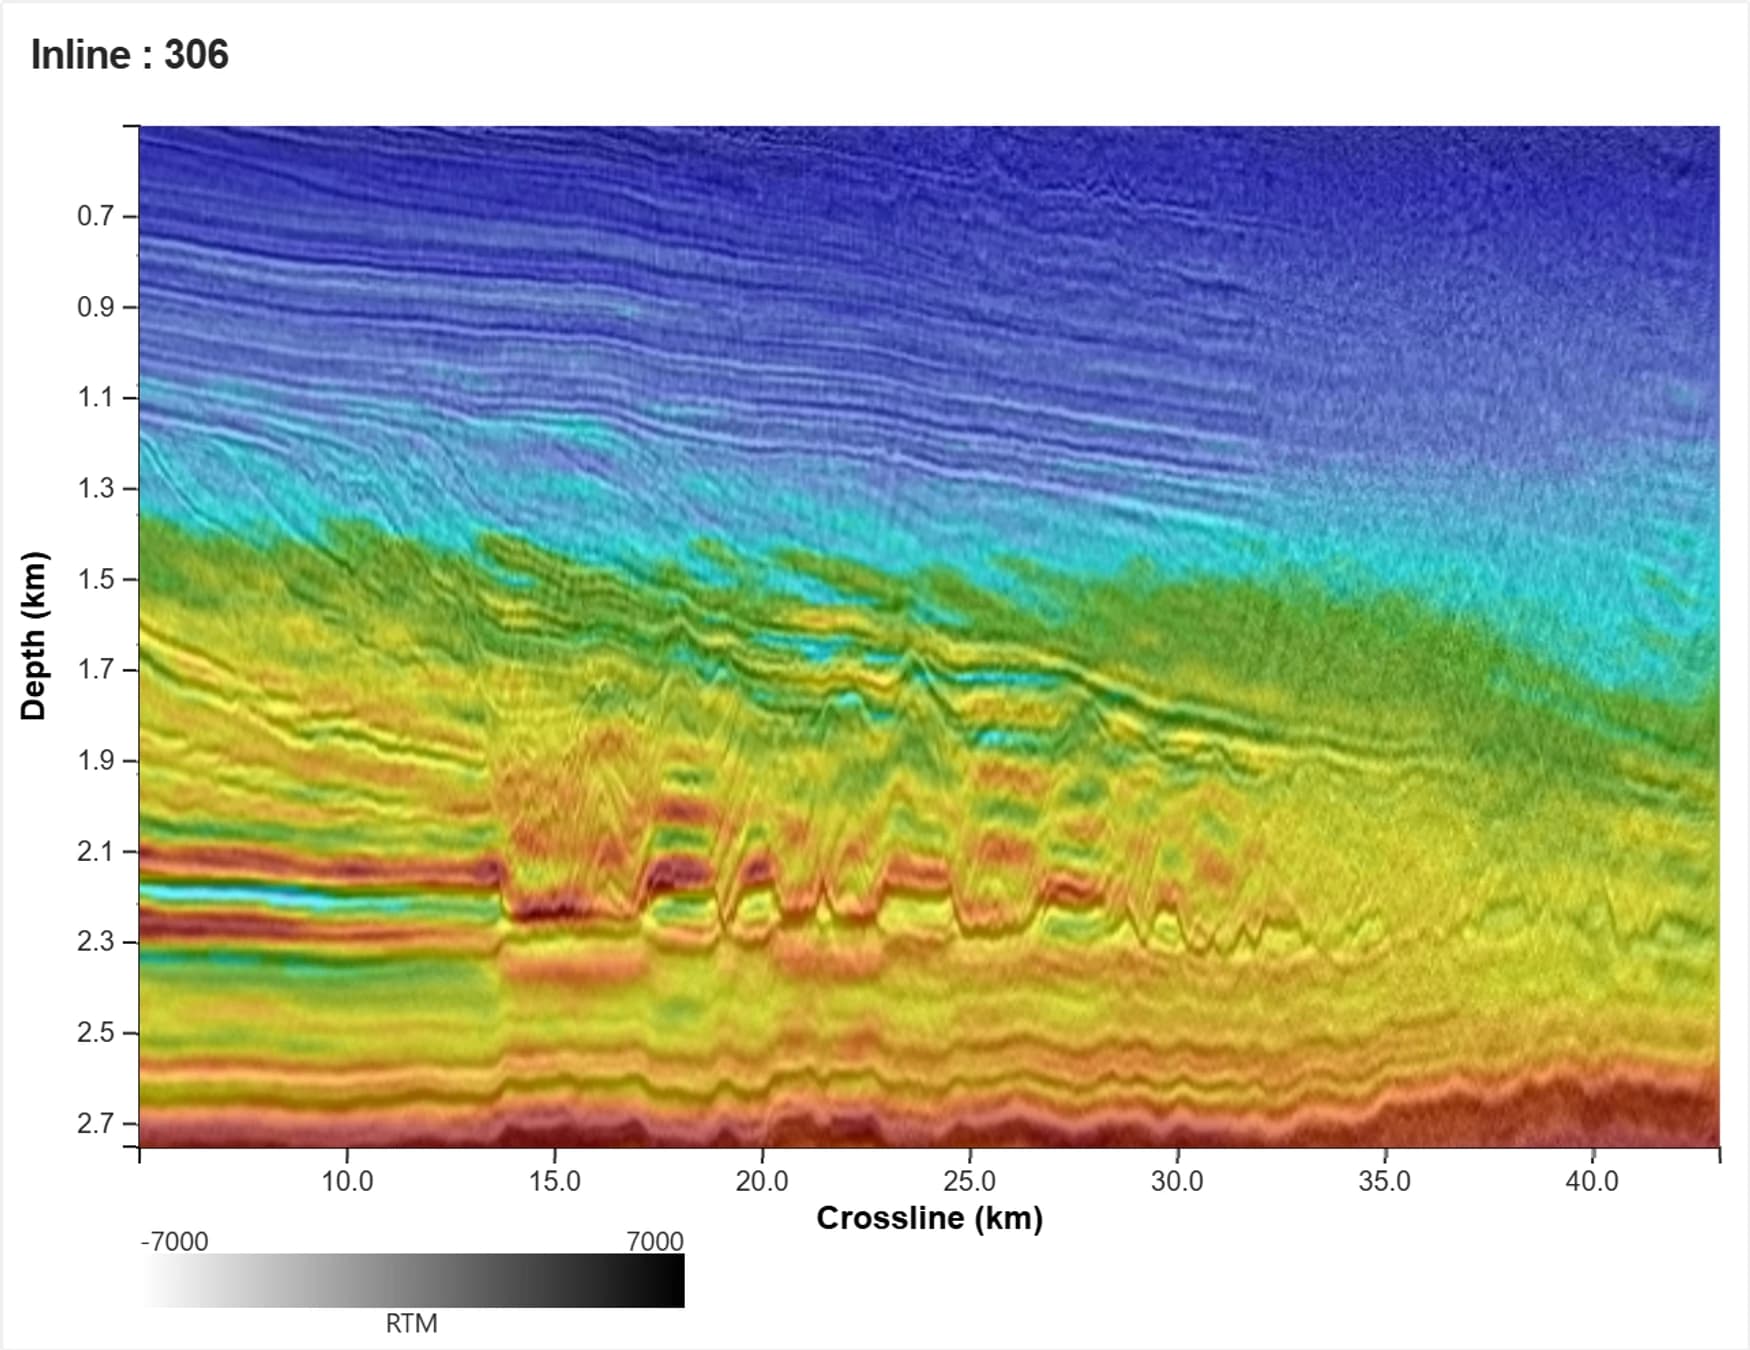
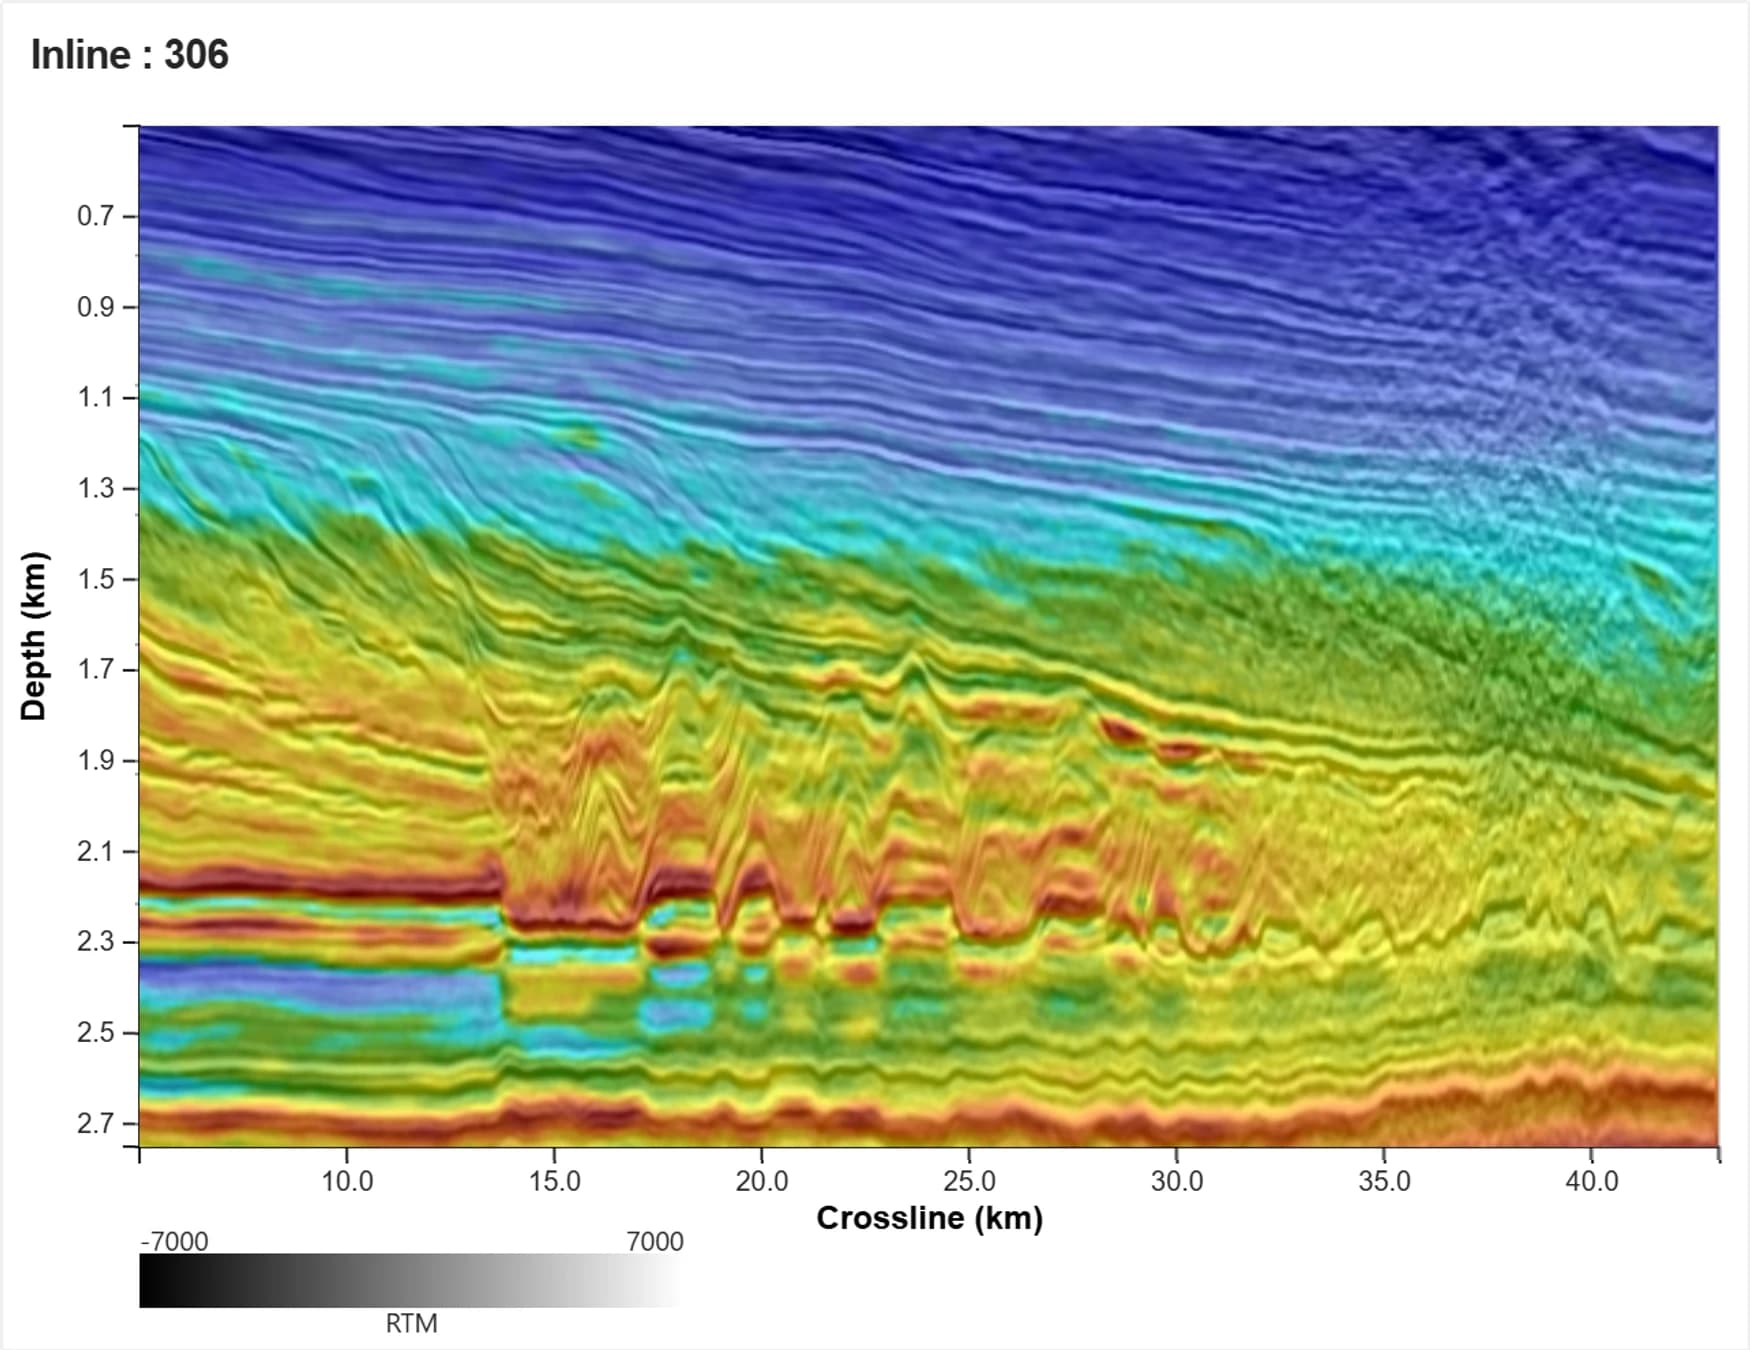
Four inlines, four stages. Vp overlaid on the KPSDM migrated with that model — flip through and the shallow section stops smearing while the clinoforms lock in. The outlined zone at the top of the section is the ice layer and permafrost that makes the shallow data so noisy.
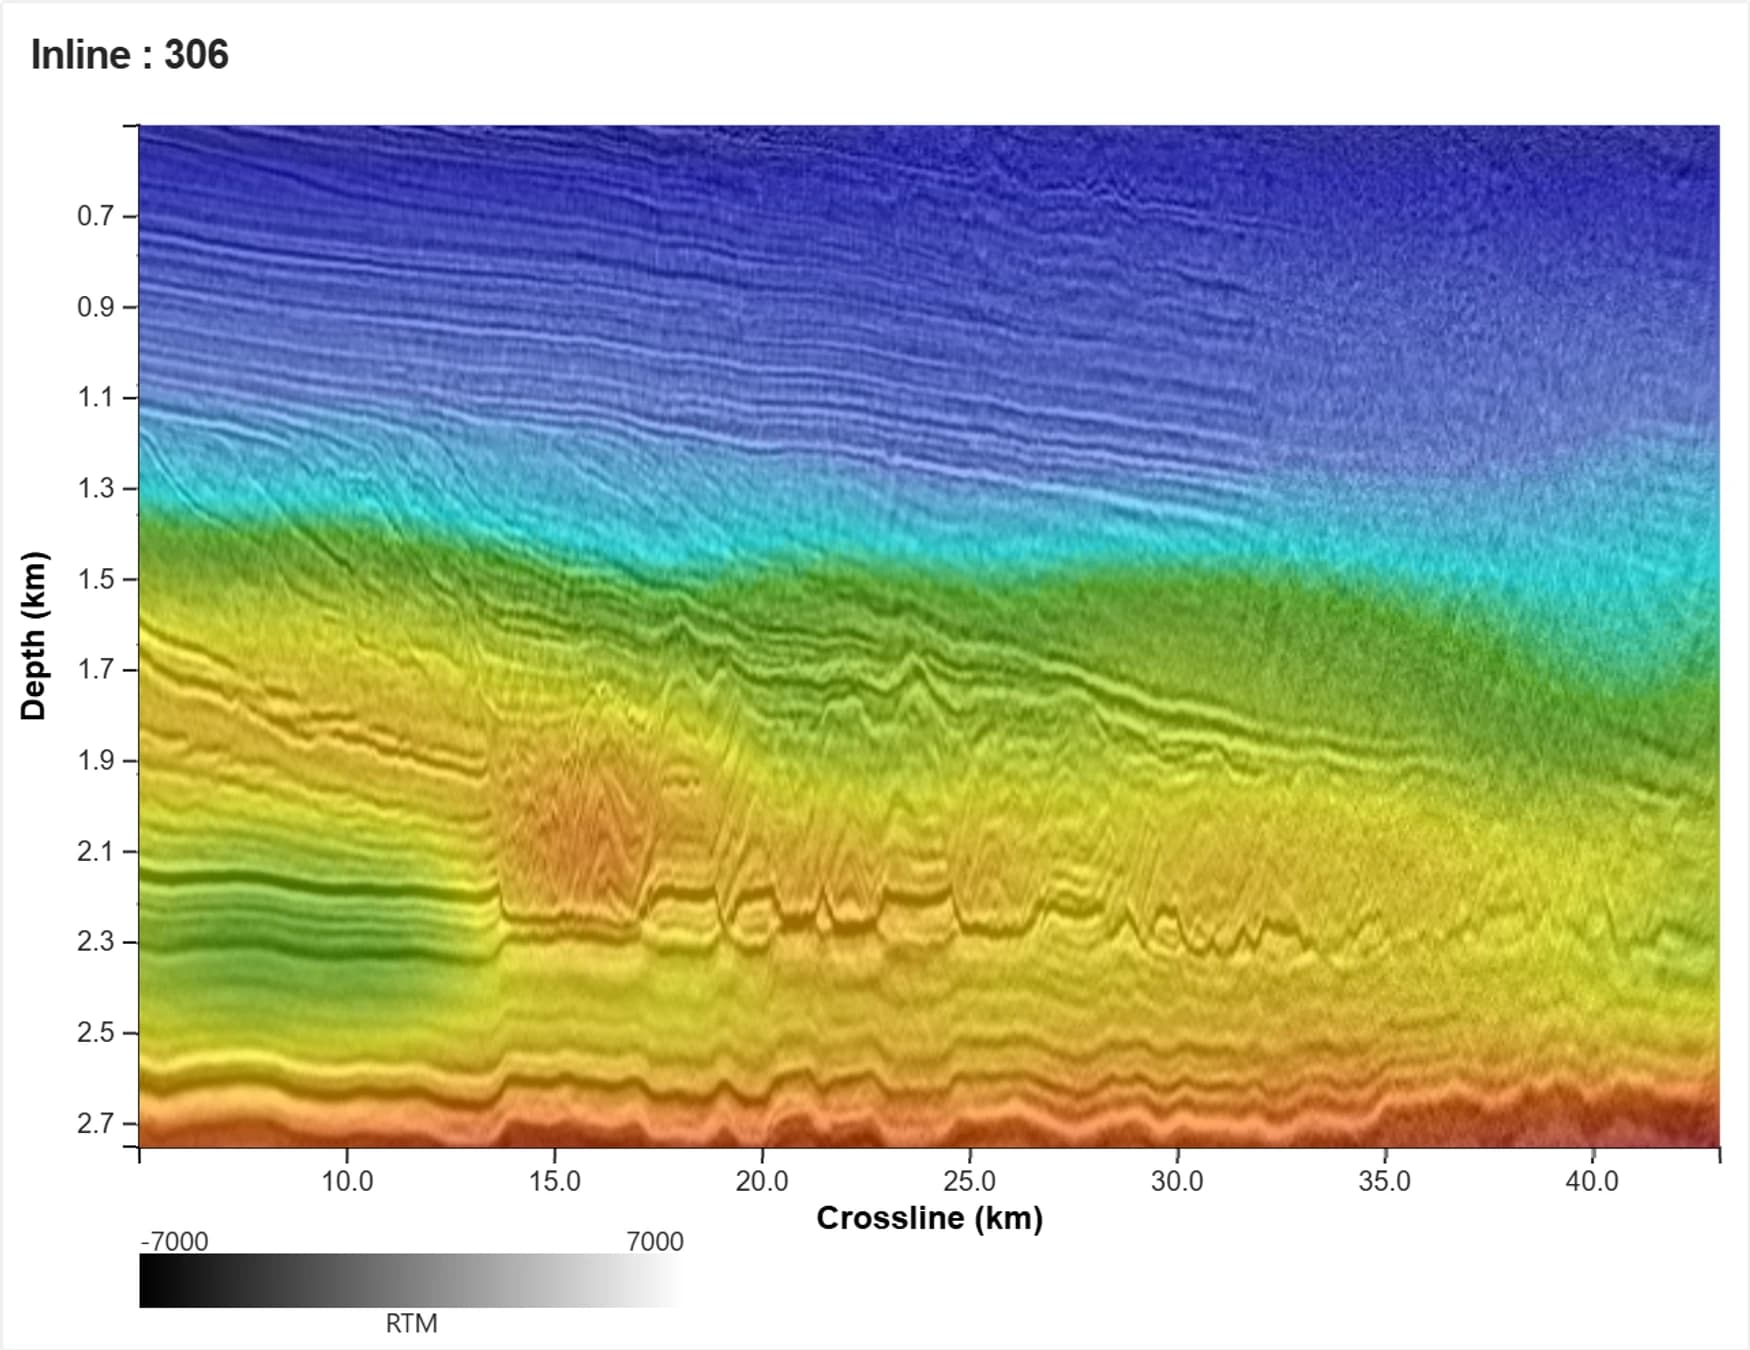
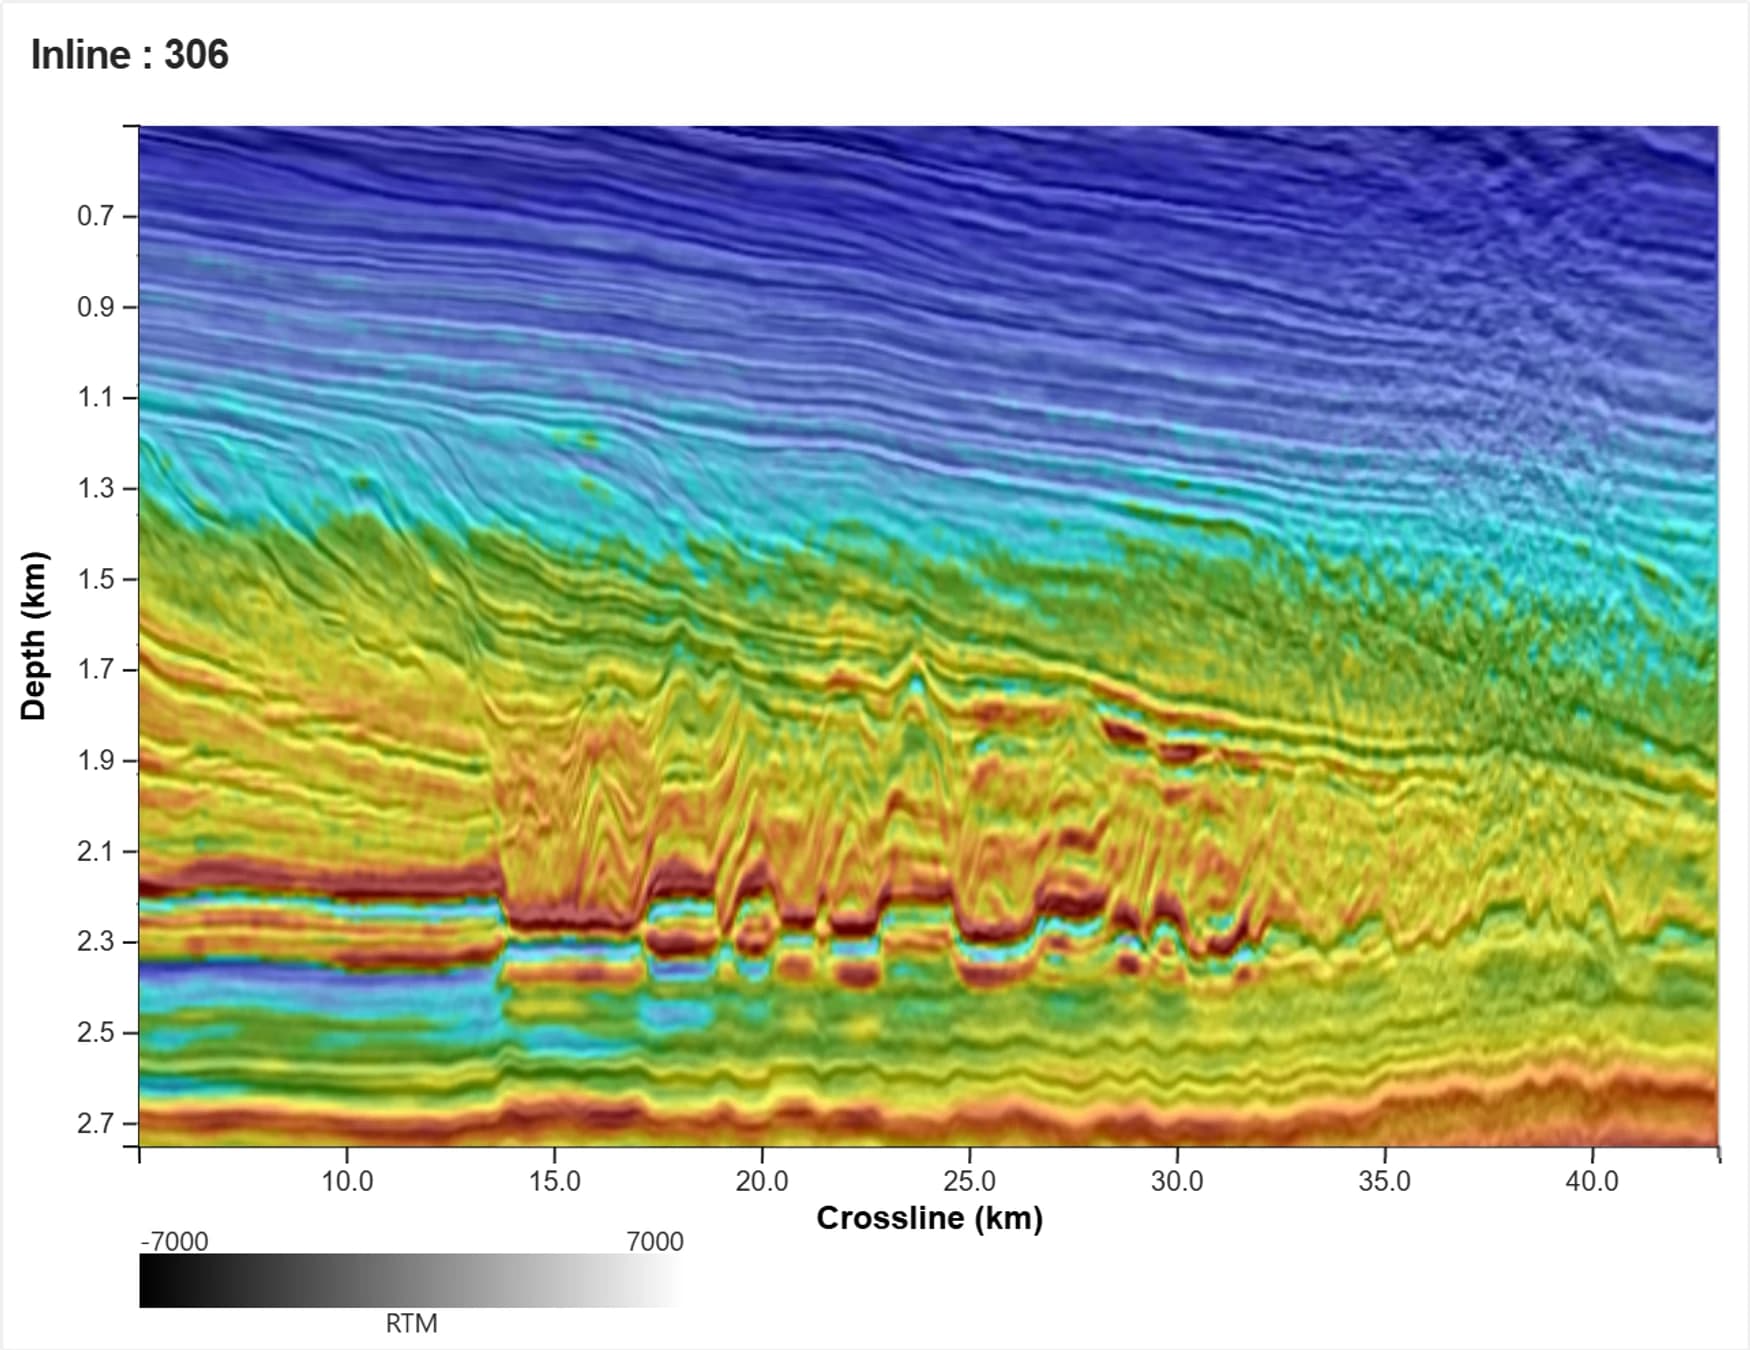
Smooth tomographic background. Nothing in the snow zone to pick.
The prospects, in map view
Depth slice through the prospect interval, same four stages. The legacy model is a smooth gradient; by the targeted update the shelf-edge clinoforms are individually resolved and the amplitude along them is mappable.
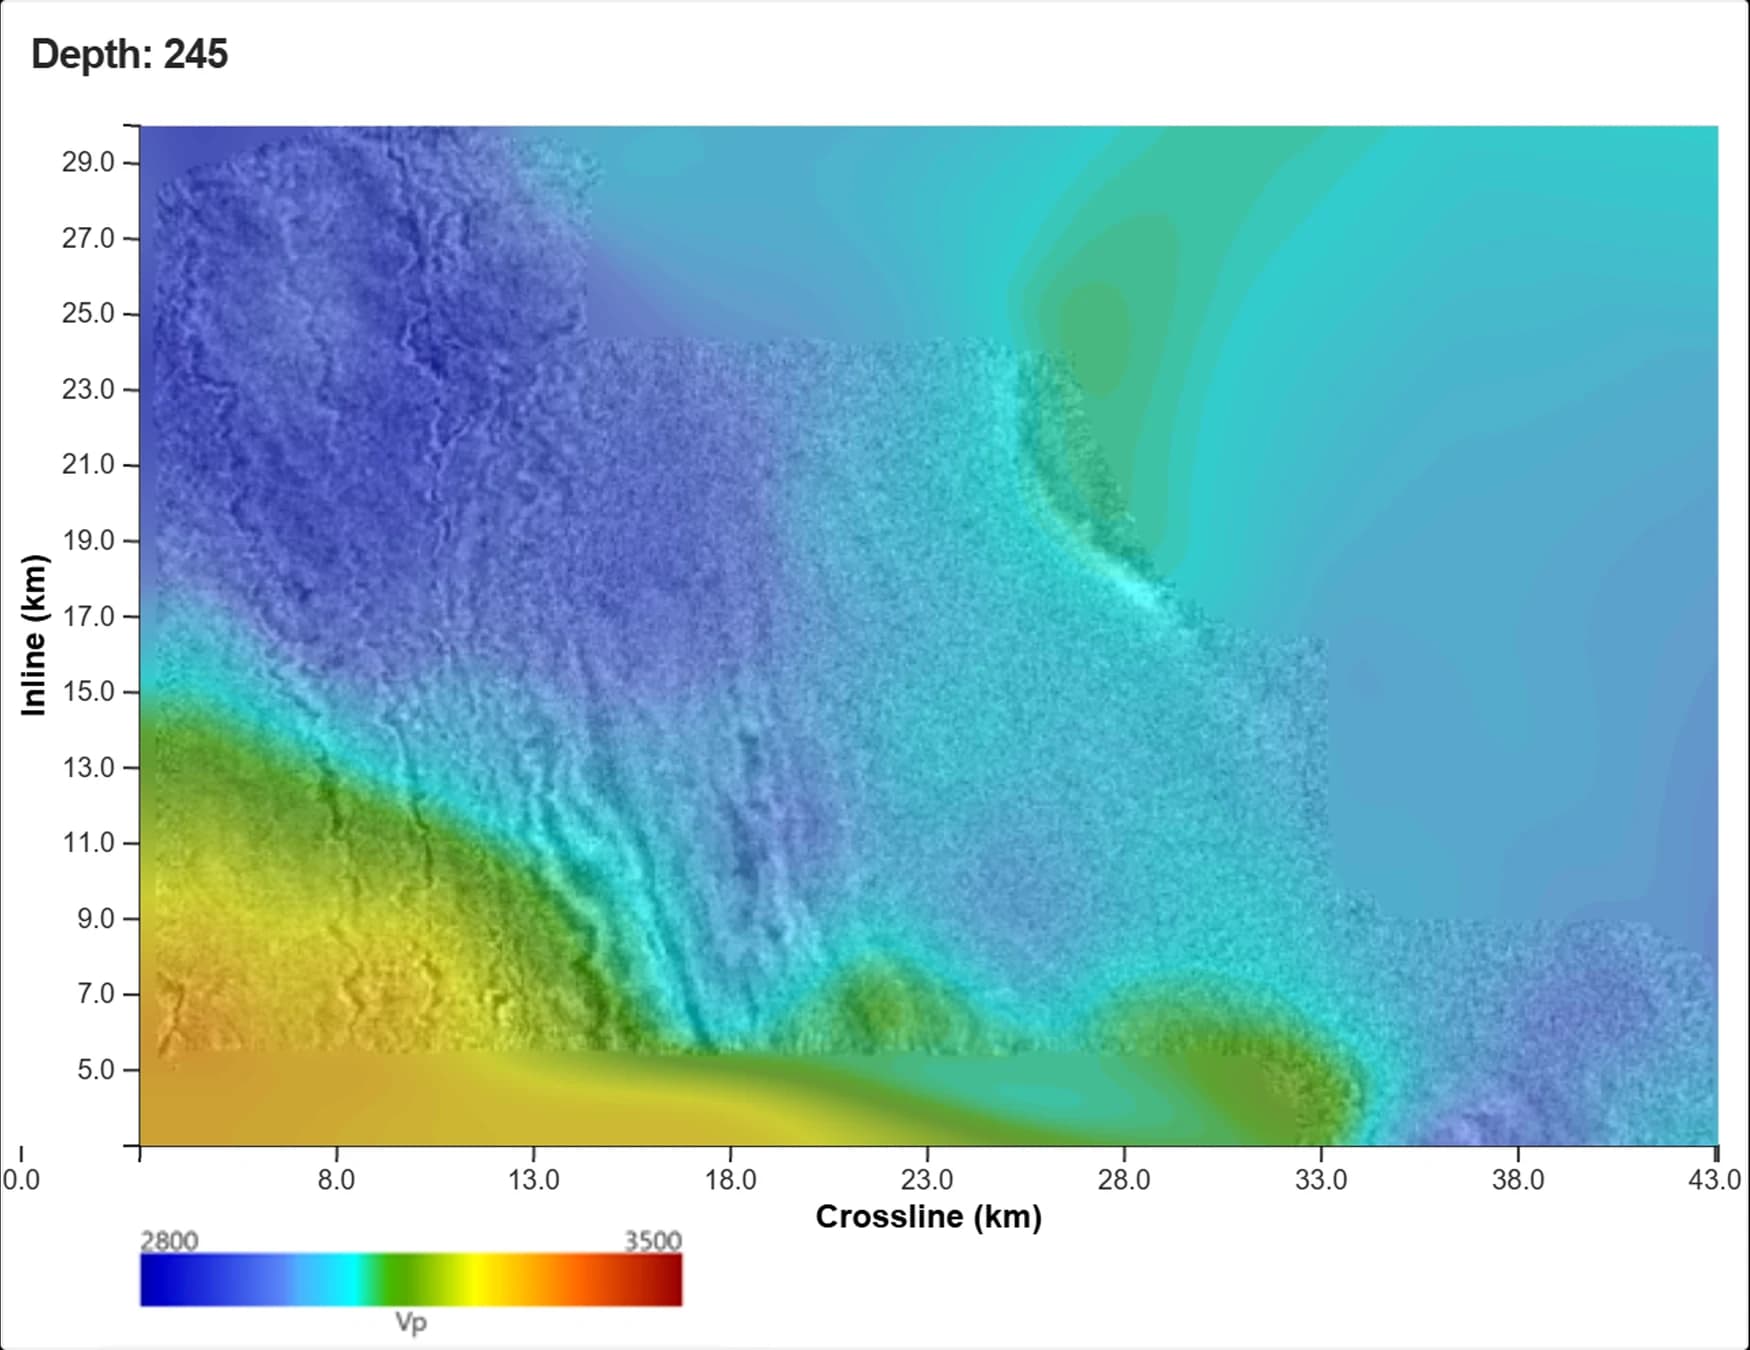
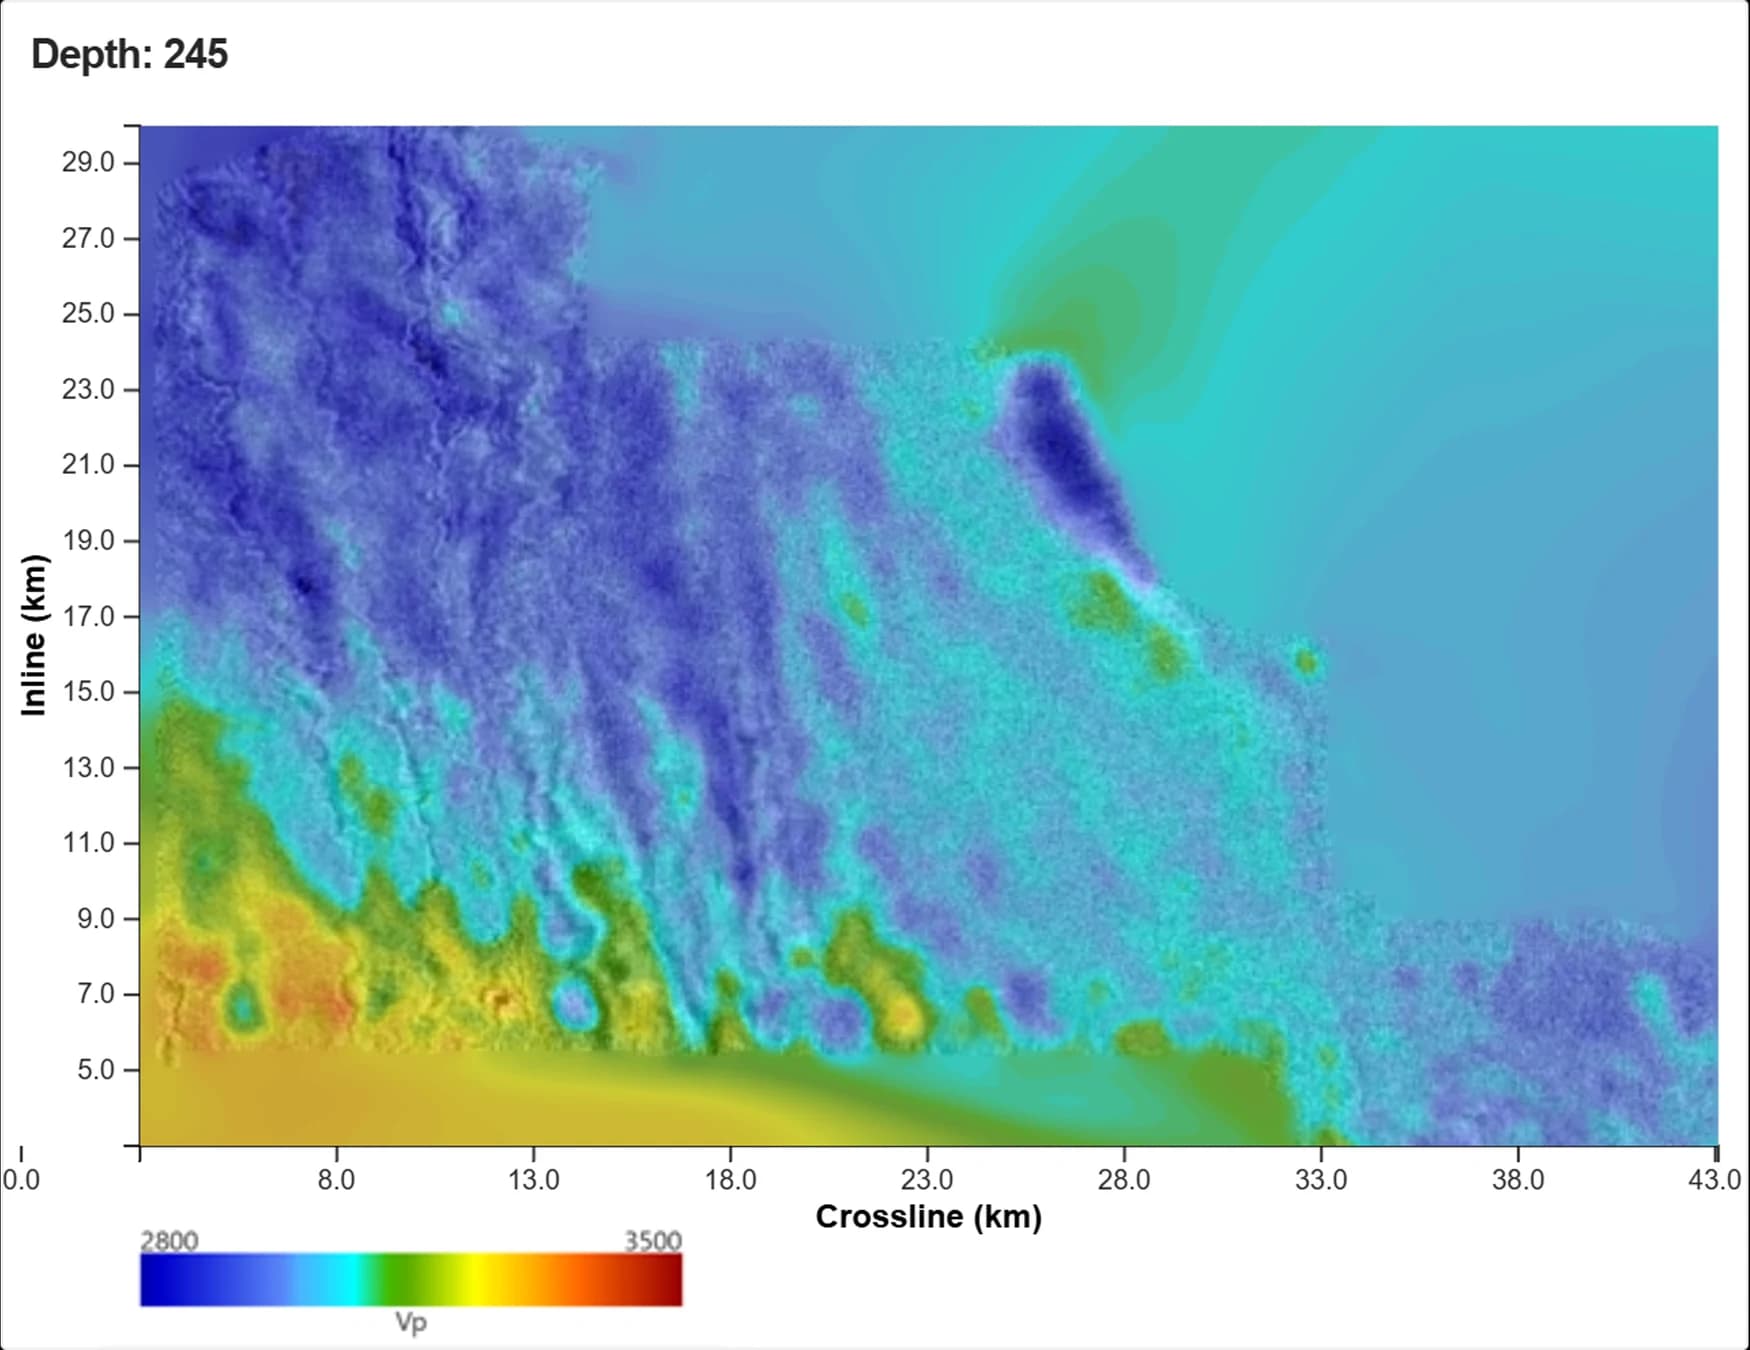
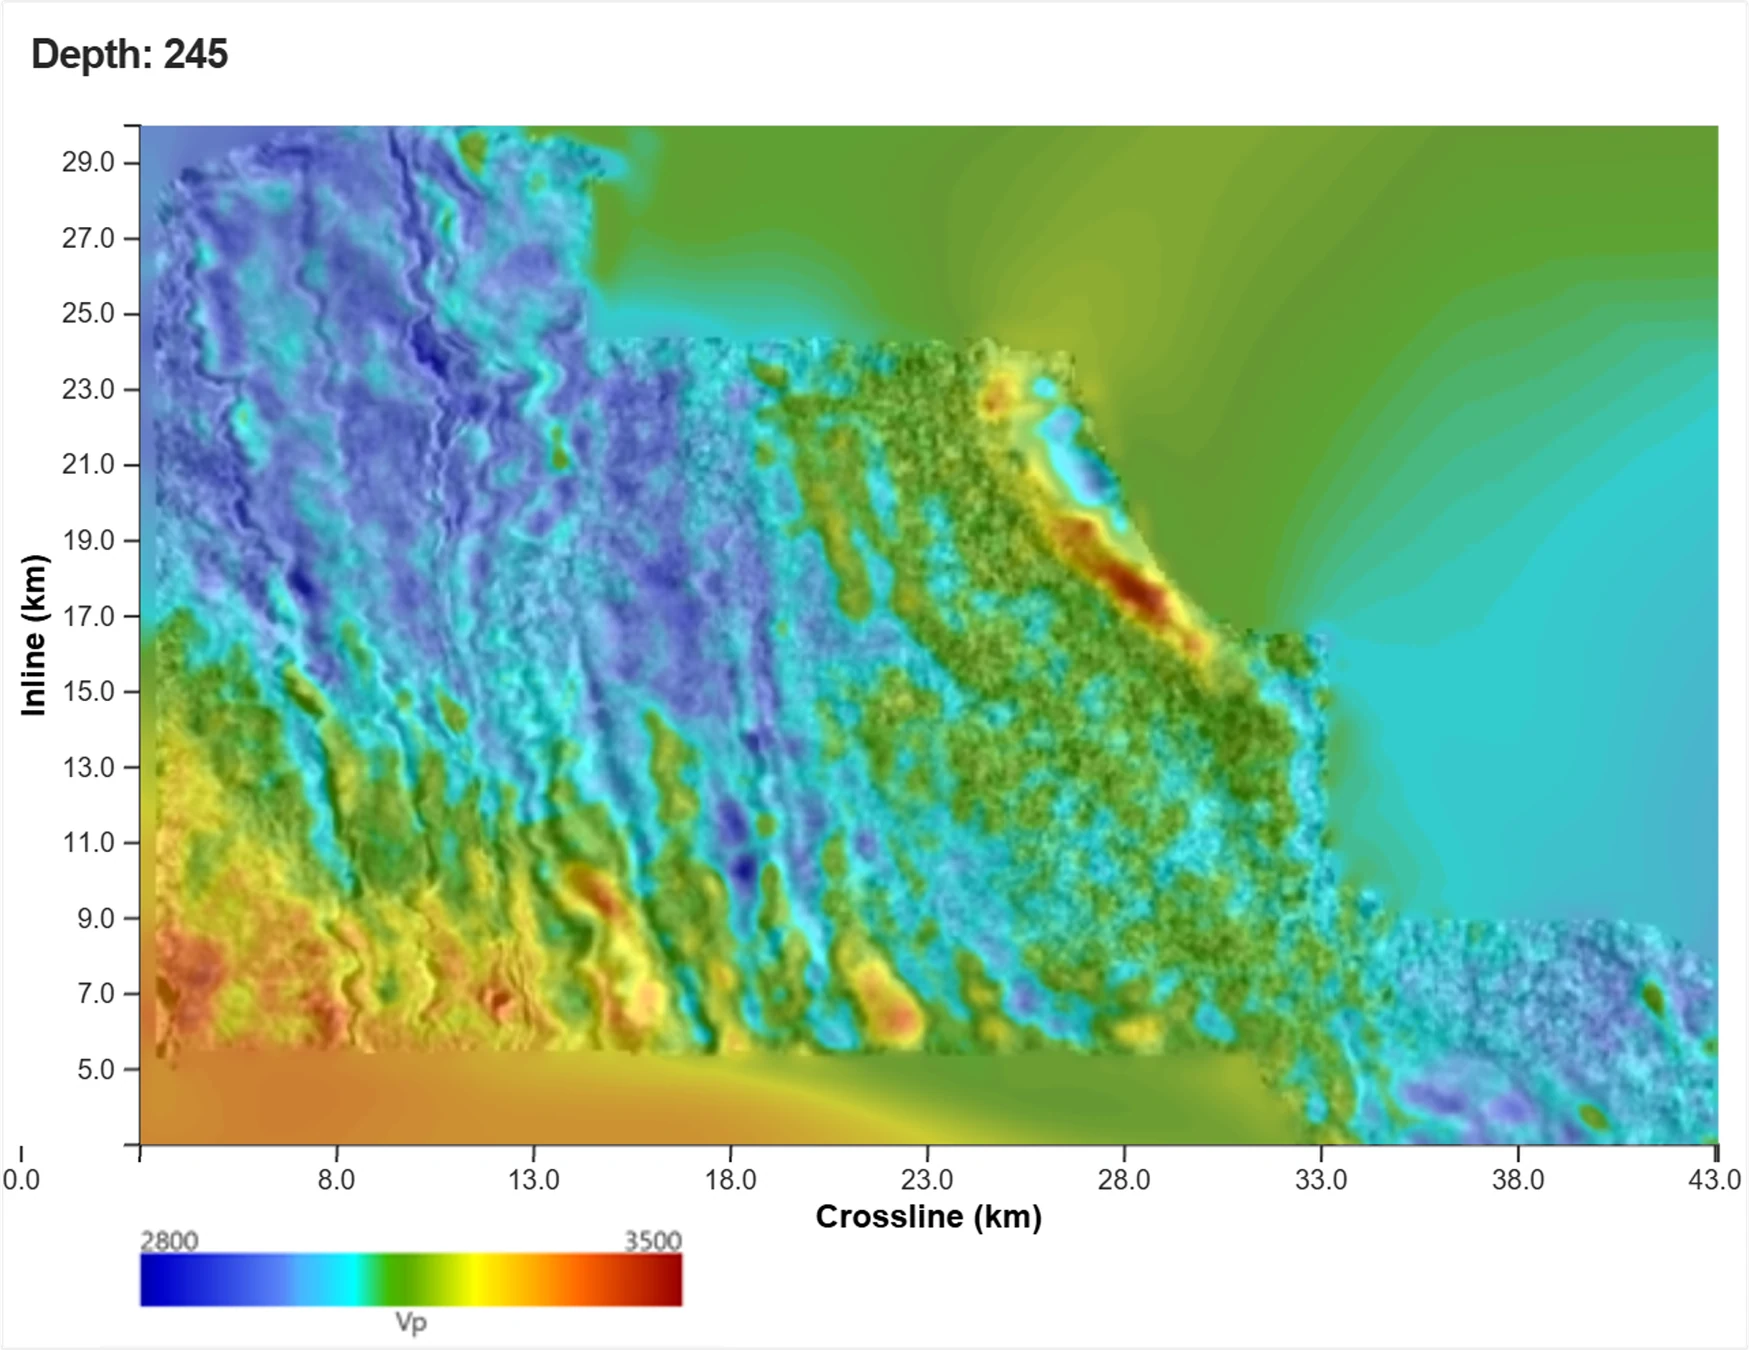
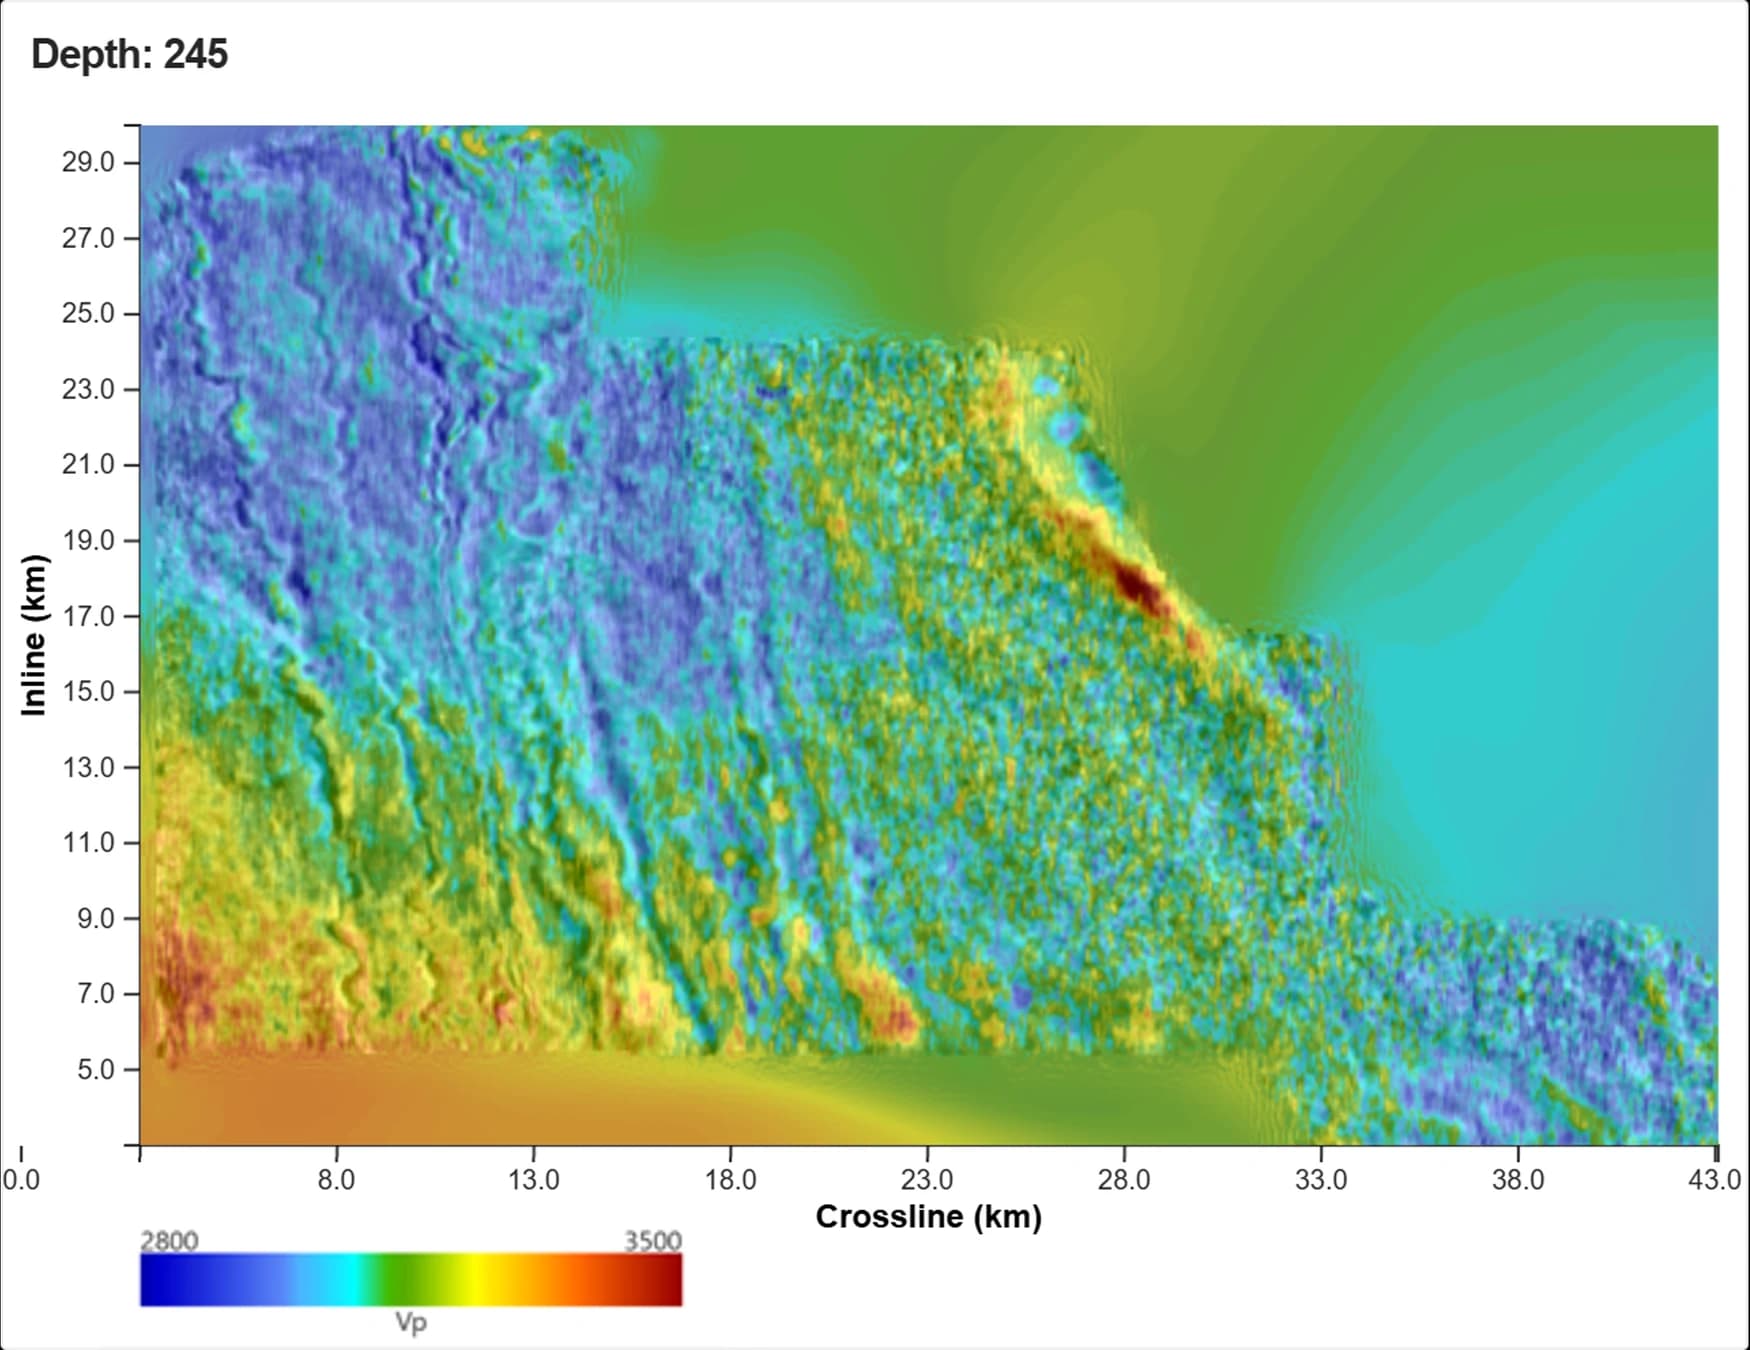
A smooth regional gradient — no prospect-scale detail anywhere.
Four products off one inversion
The velocity model is the means, not the end. Everything on this page comes out of the same 45 Hz inversion of the merged volume.
Macro TSL-FWI™ velocity
The regional update, straight from the field data. Recovers the trend through the noisy interval and puts structure back on the section.
Targeted TSL-FWI™ velocity
A focused update at the prospect interval that resolves individual clinoforms — what turns a velocity model into a prospect inventory.
TSL-FWI™ FDR reflectivity
Reflectivity read directly out of the inversion, 10 to 45 Hz from a lowest usable frequency of 8 Hz. Independent of the migration.
Angle stacks for AVA
Mid, far and ultra-far KPSDM plus FDR angle slices, so the AVA signature that discriminates charged sand can be measured.
Reflectivity straight out of the inversion
FWI-derived reflectivity at 10, 16, 32 and 45 Hz.
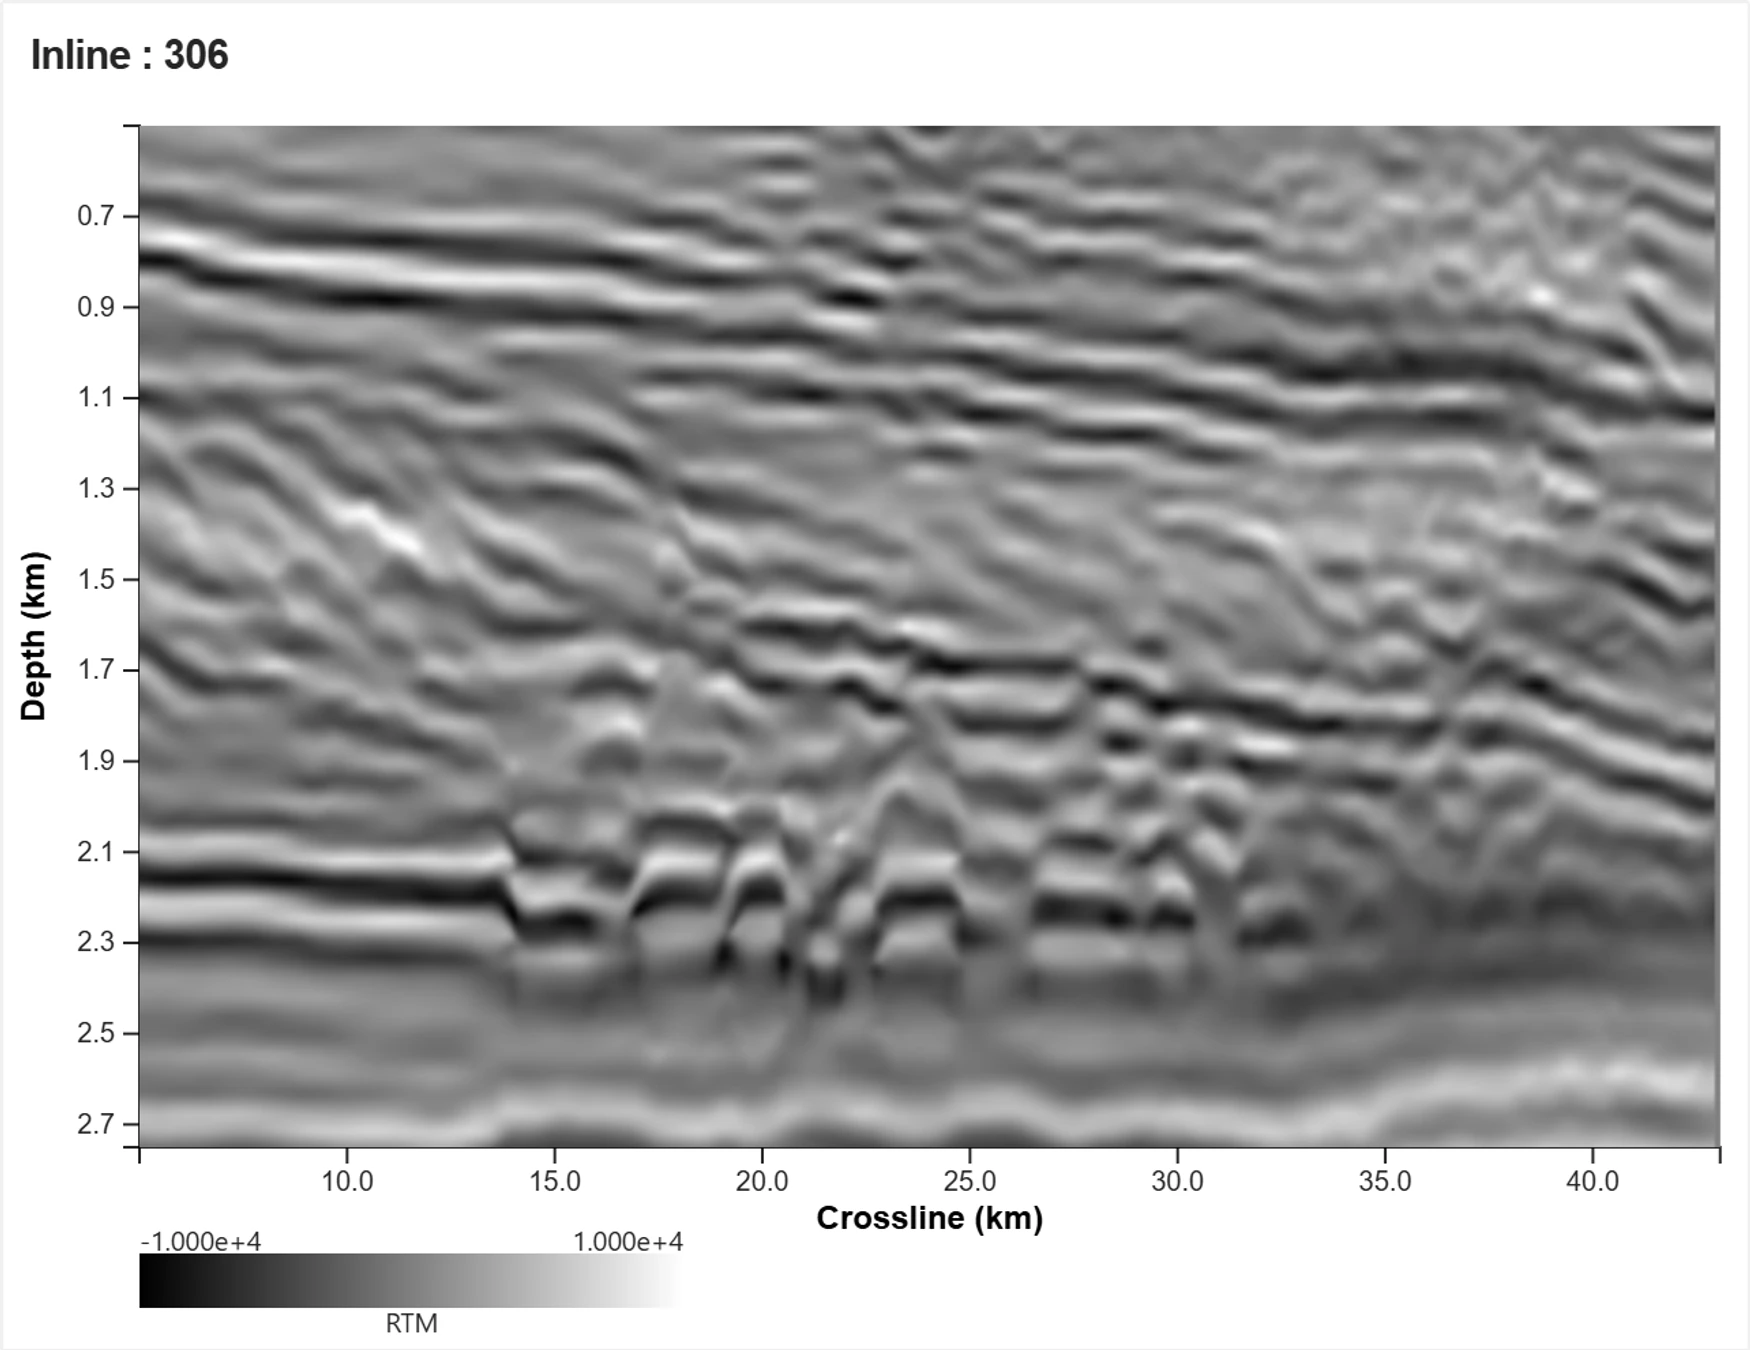
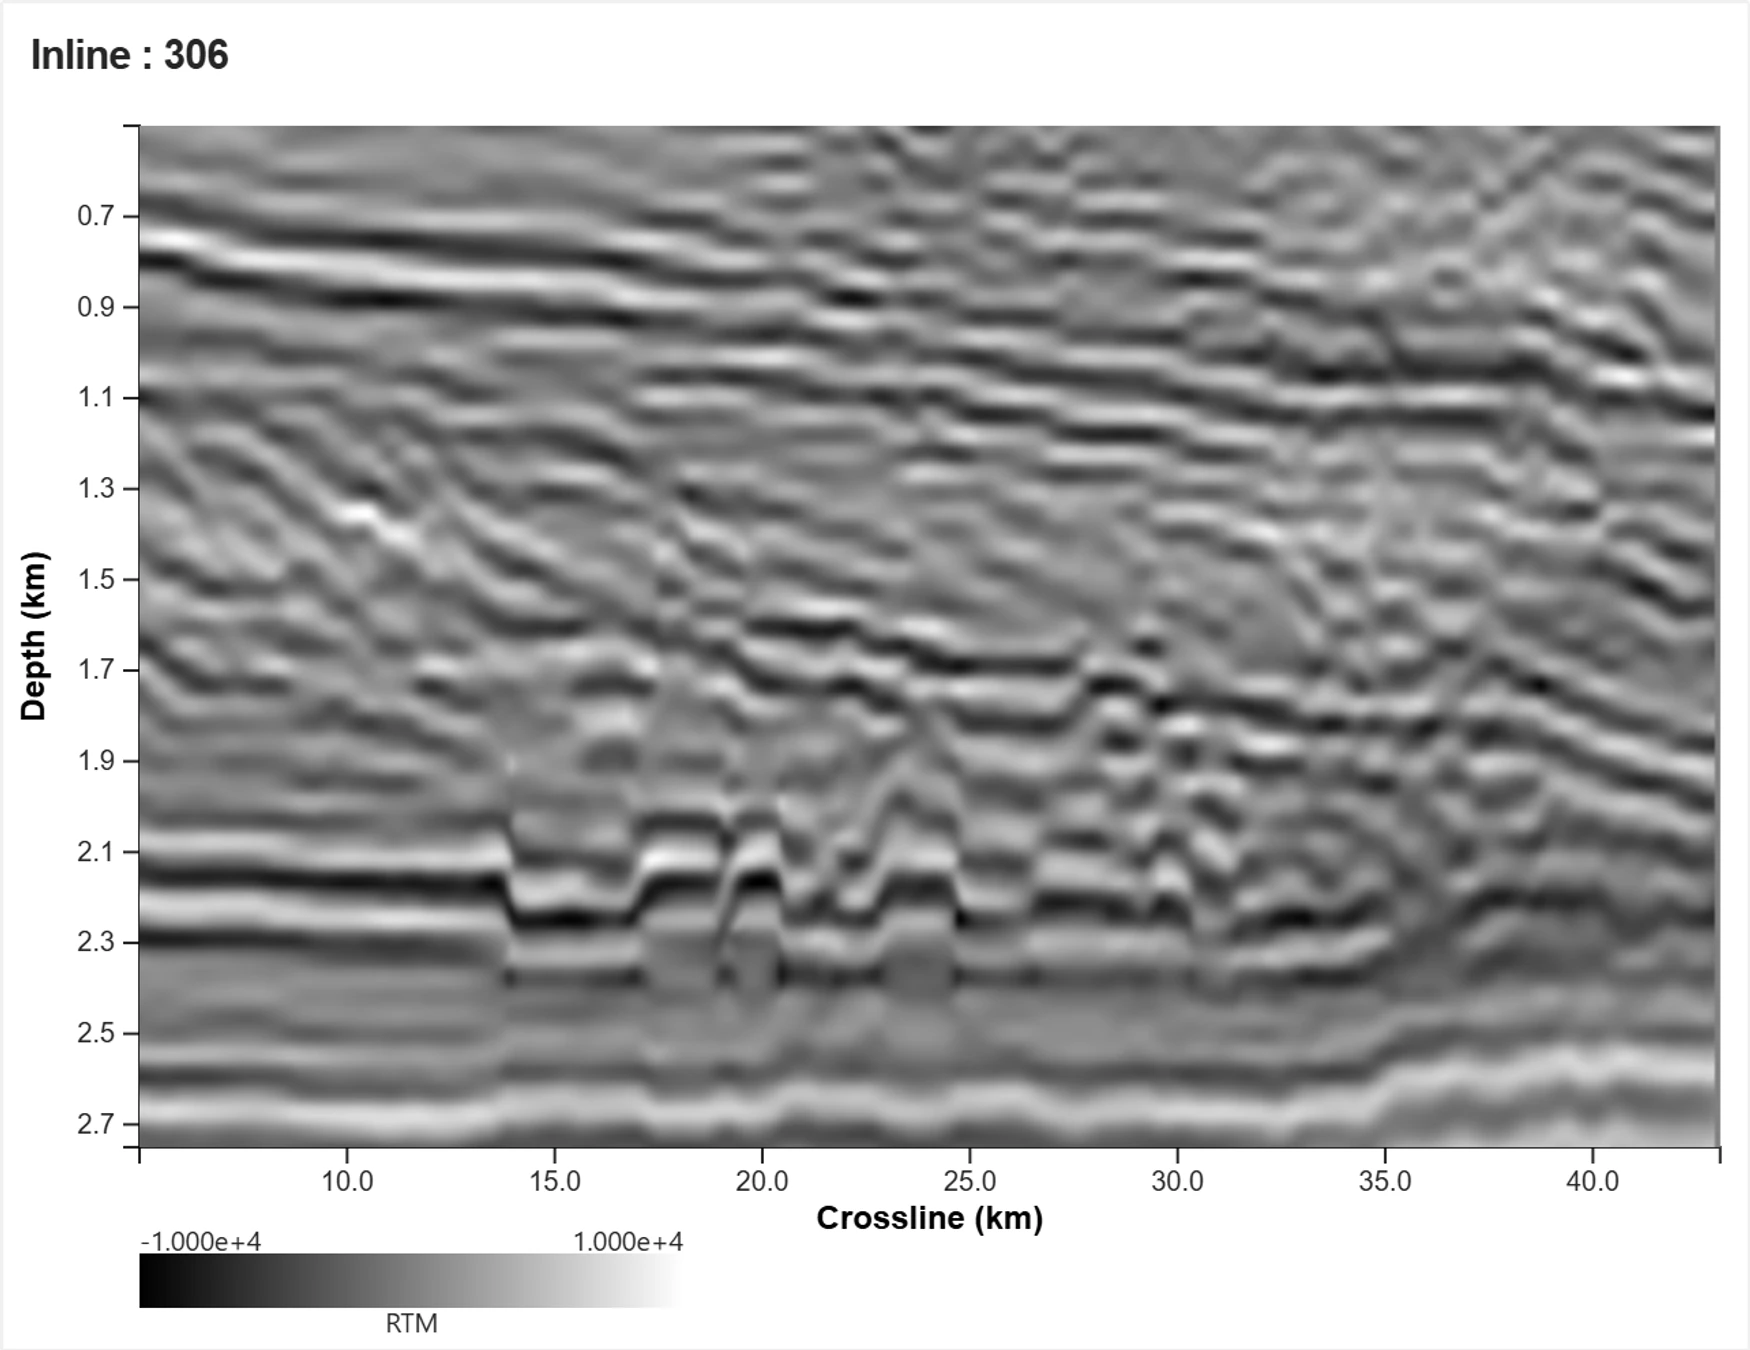
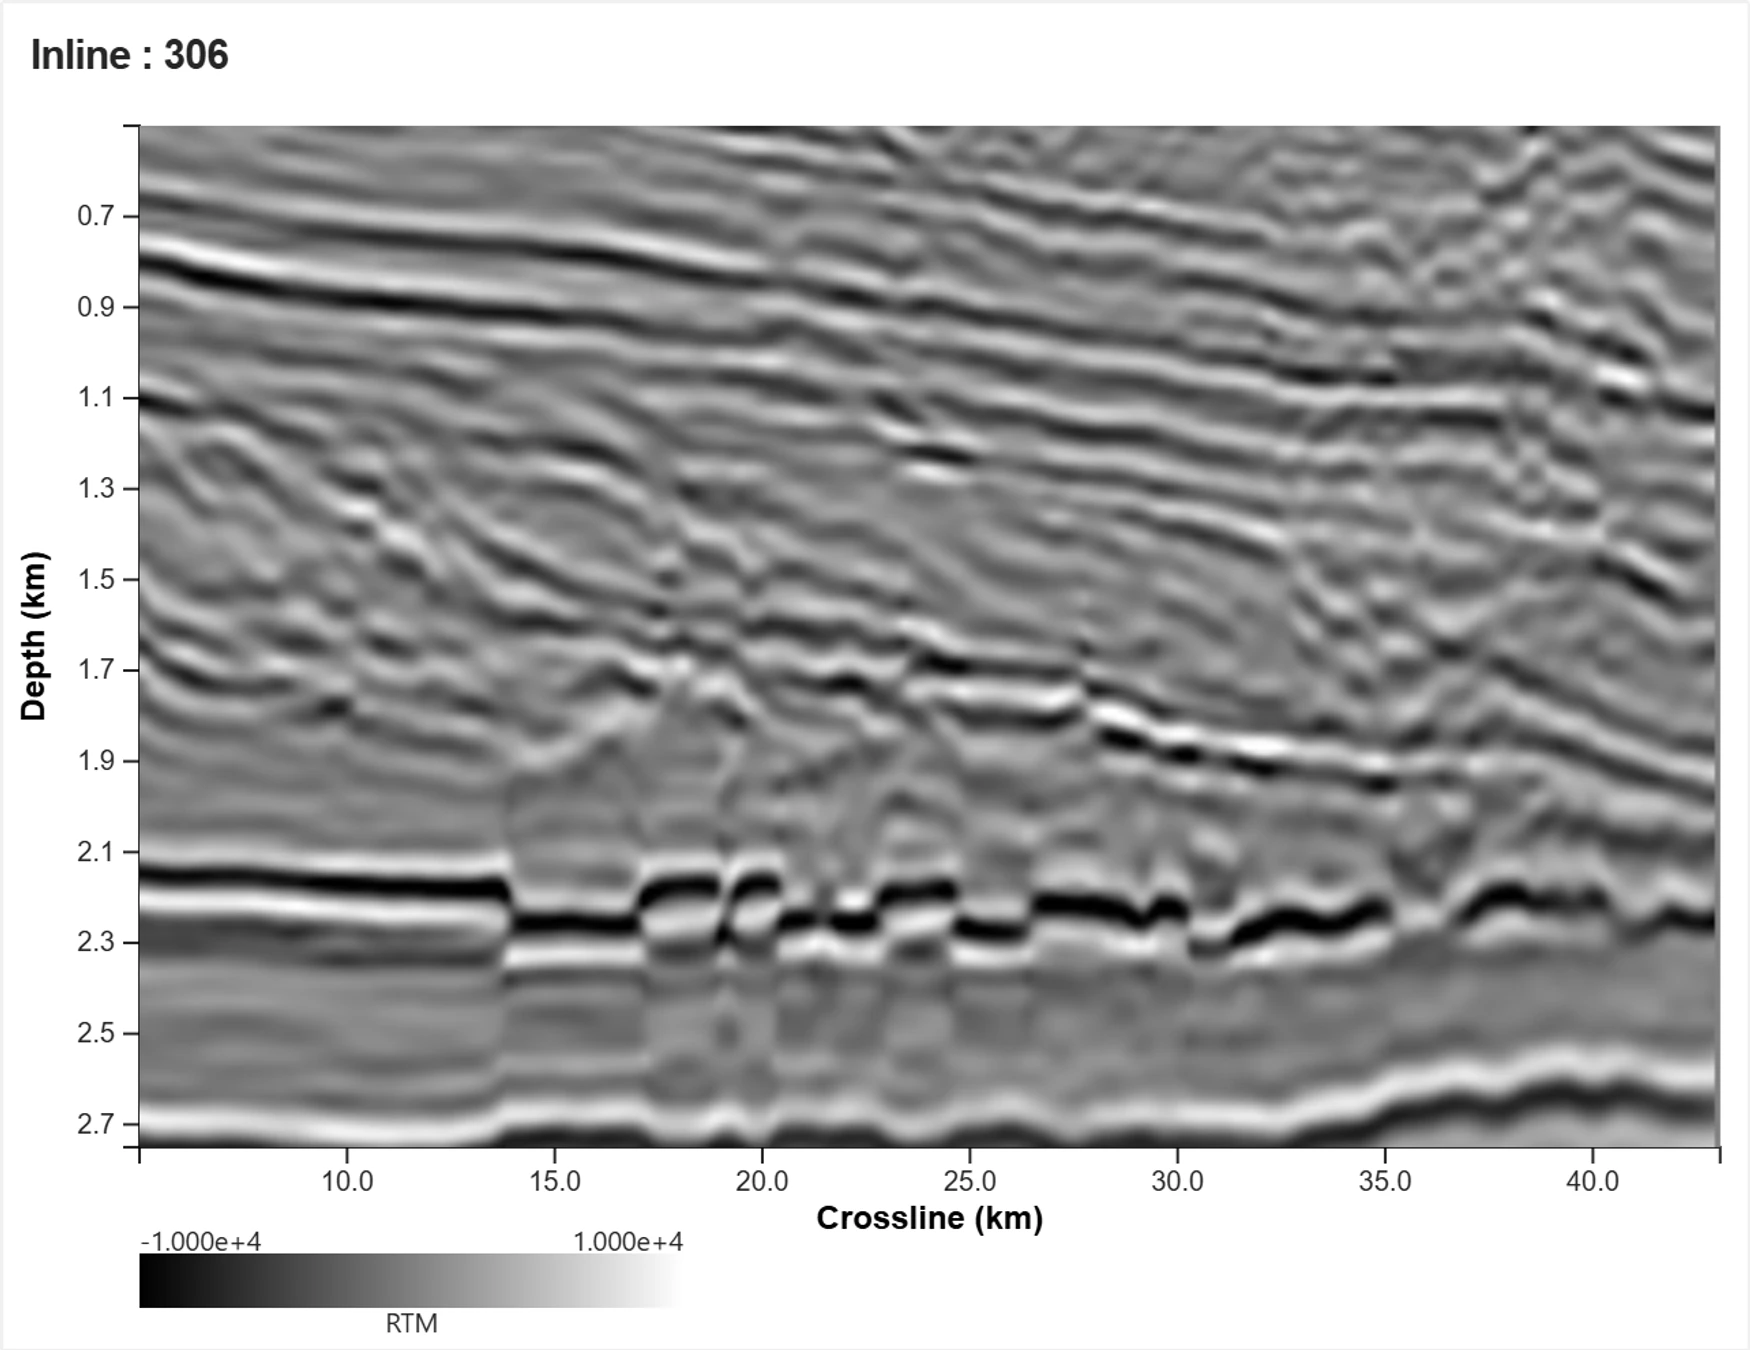
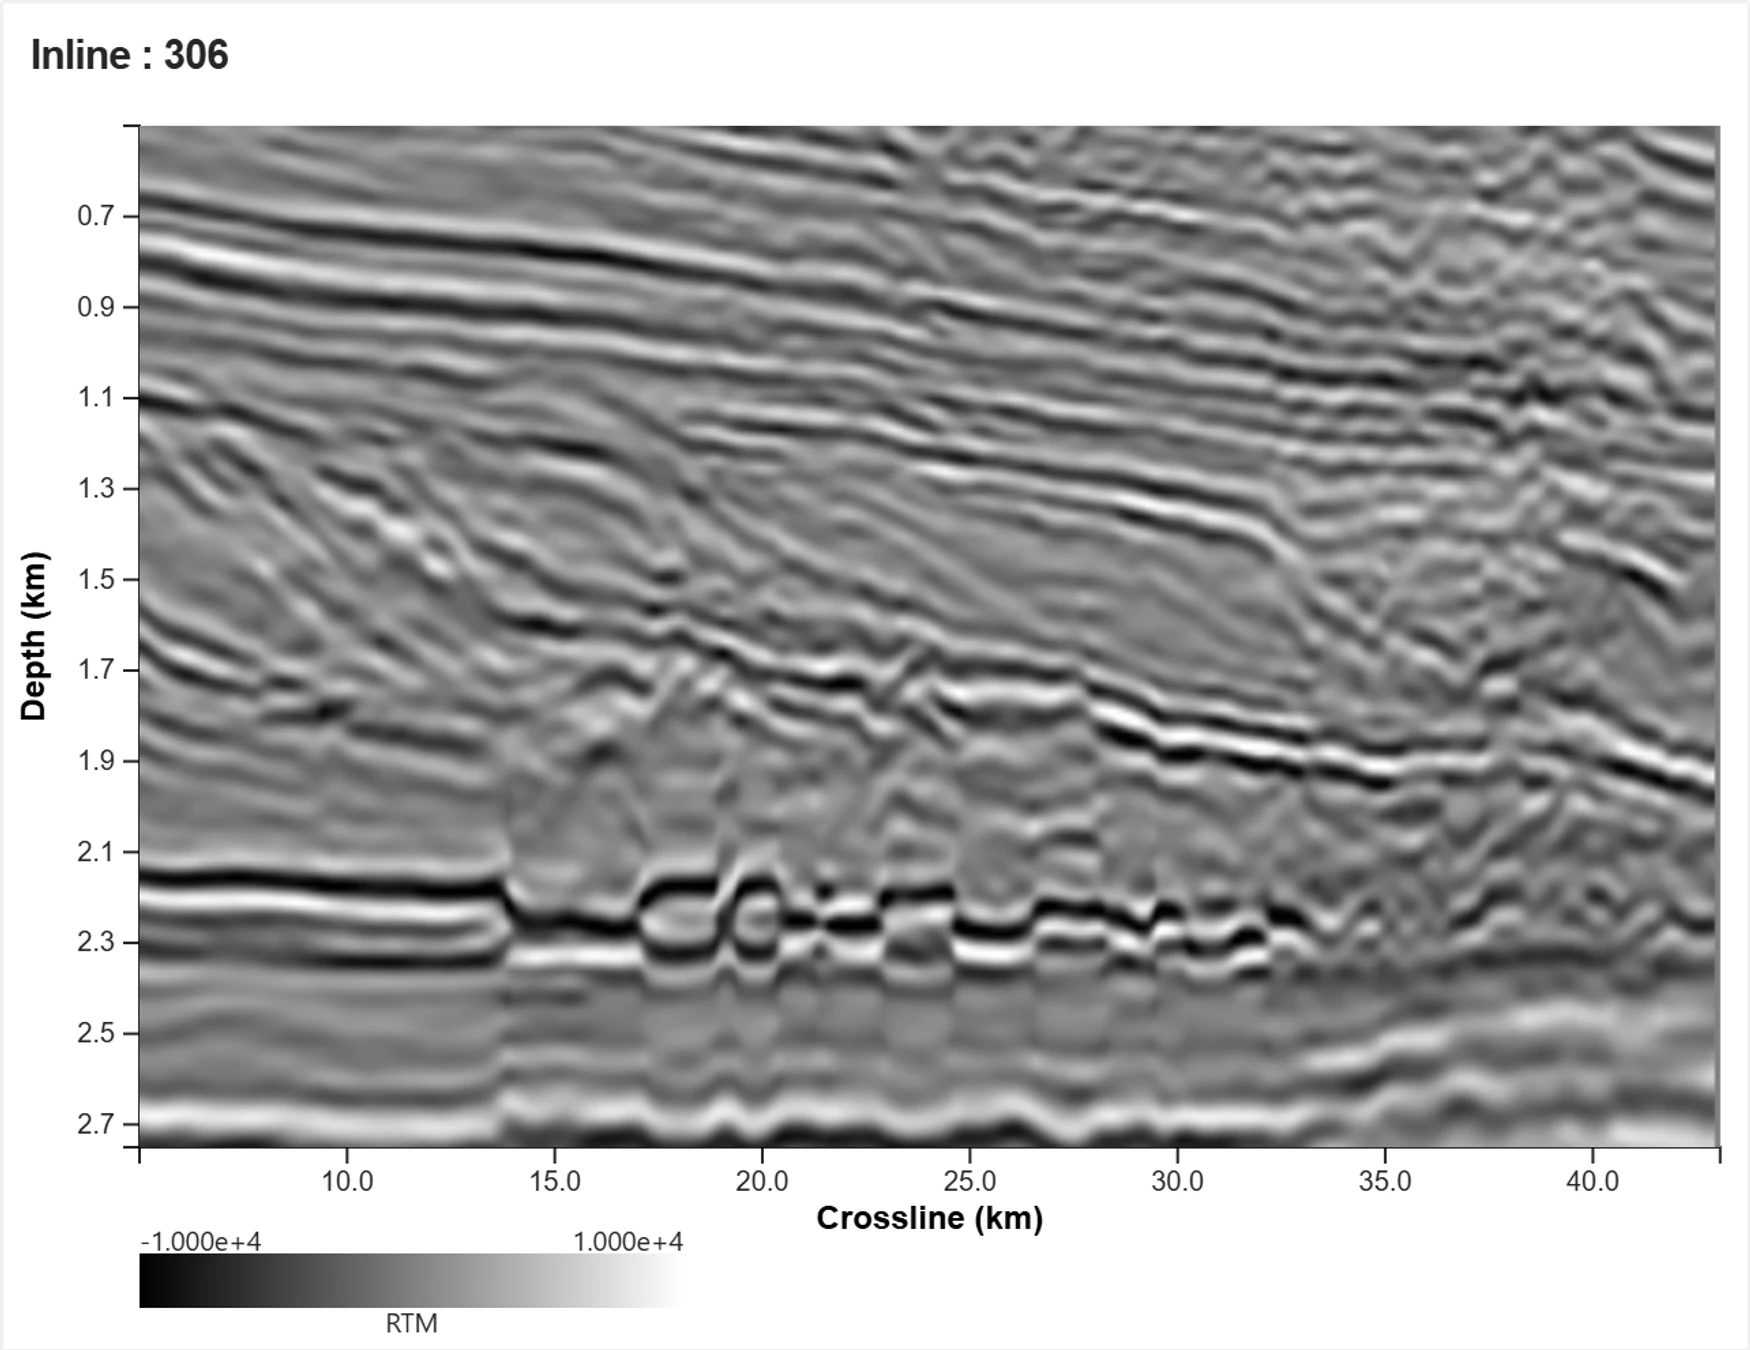
Reflectivity out of the inversion at 10 Hz.
We can do this on your data
Legacy surveys, minimal pre-processing, no picking — TSL-FWI™ run to 45 Hz on the field data The same run turns vintage 3D into a prospect inventory, and we can have it back to you in weeks.
West Harrison Bay, Alaska North Slope. Vibroseis and airgun data acquired 2006 across two surveys, inverted together with X-Wave TSL-FWI™. Reserve and prospect counts are the operator's estimates.